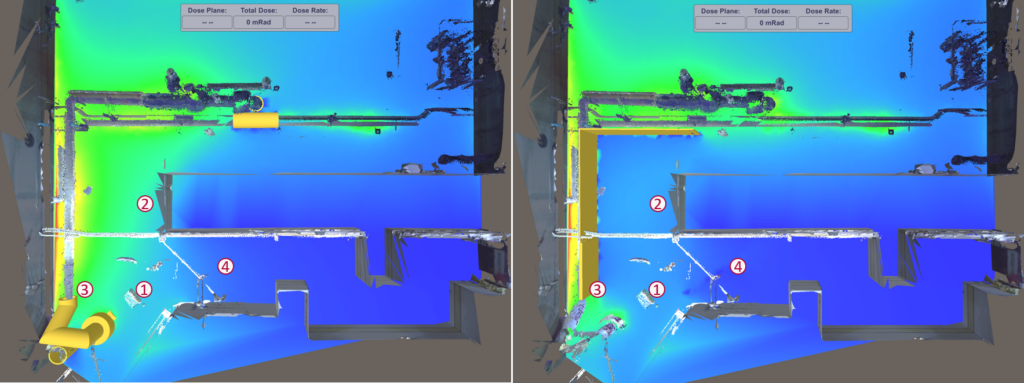
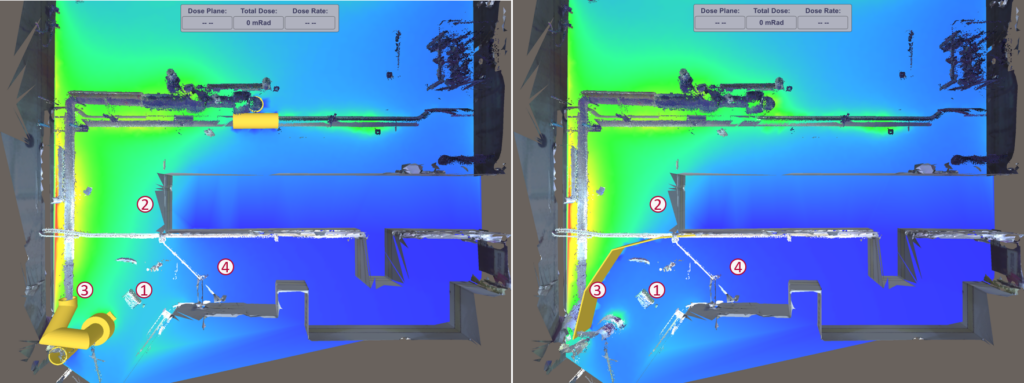
In the scope of one job, LaSalle Generating Station saved 12 Rem (120 mSv) through the use of 3D gamma radiation source mapping and intervention analysis, RadVision3D.
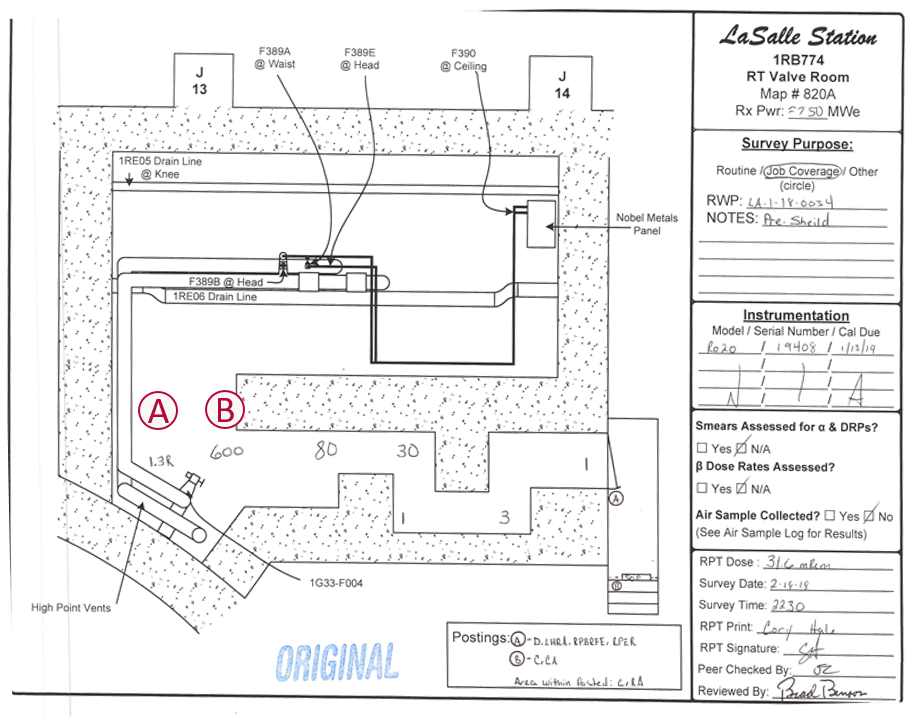
The Reactor Water Cleanup valve is an Anchor Darling valve that needed to be breached and have the internals replaced during a refuel outage. It is located in a locked high rad area. LaSalle needed an optimized shielding package that was not only quick and easy to install, but could also significantly cut down dose. Most work processes were to take place in the area circle in red below in the pre-shielding dose survey.
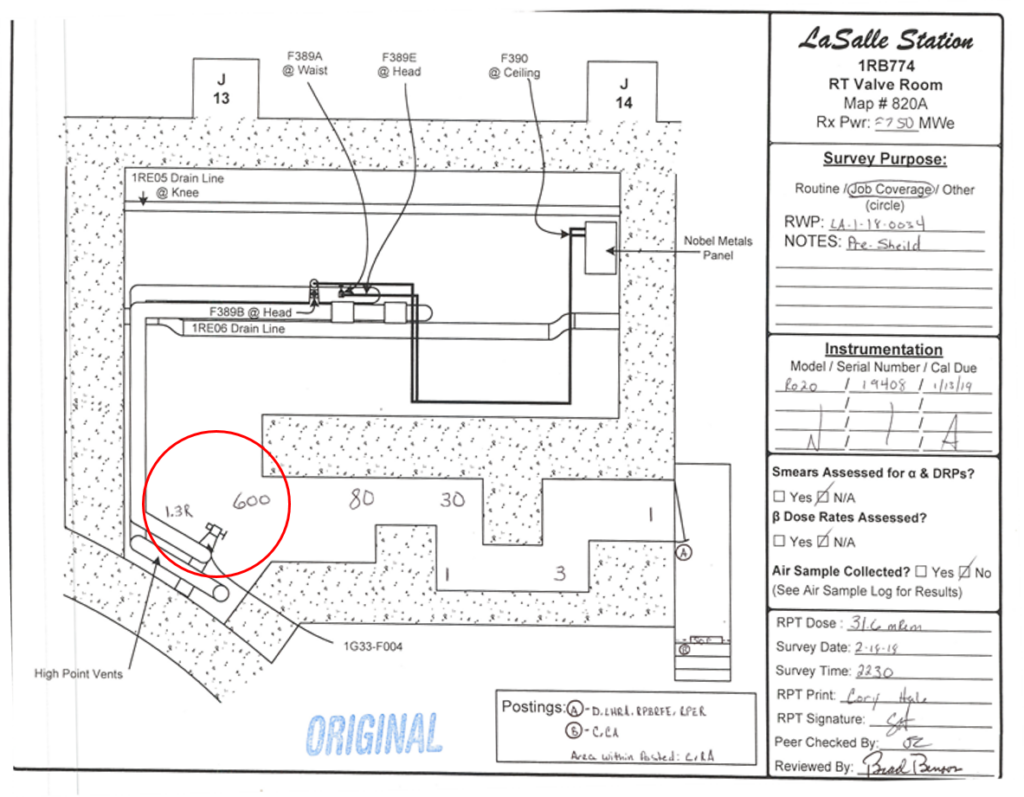
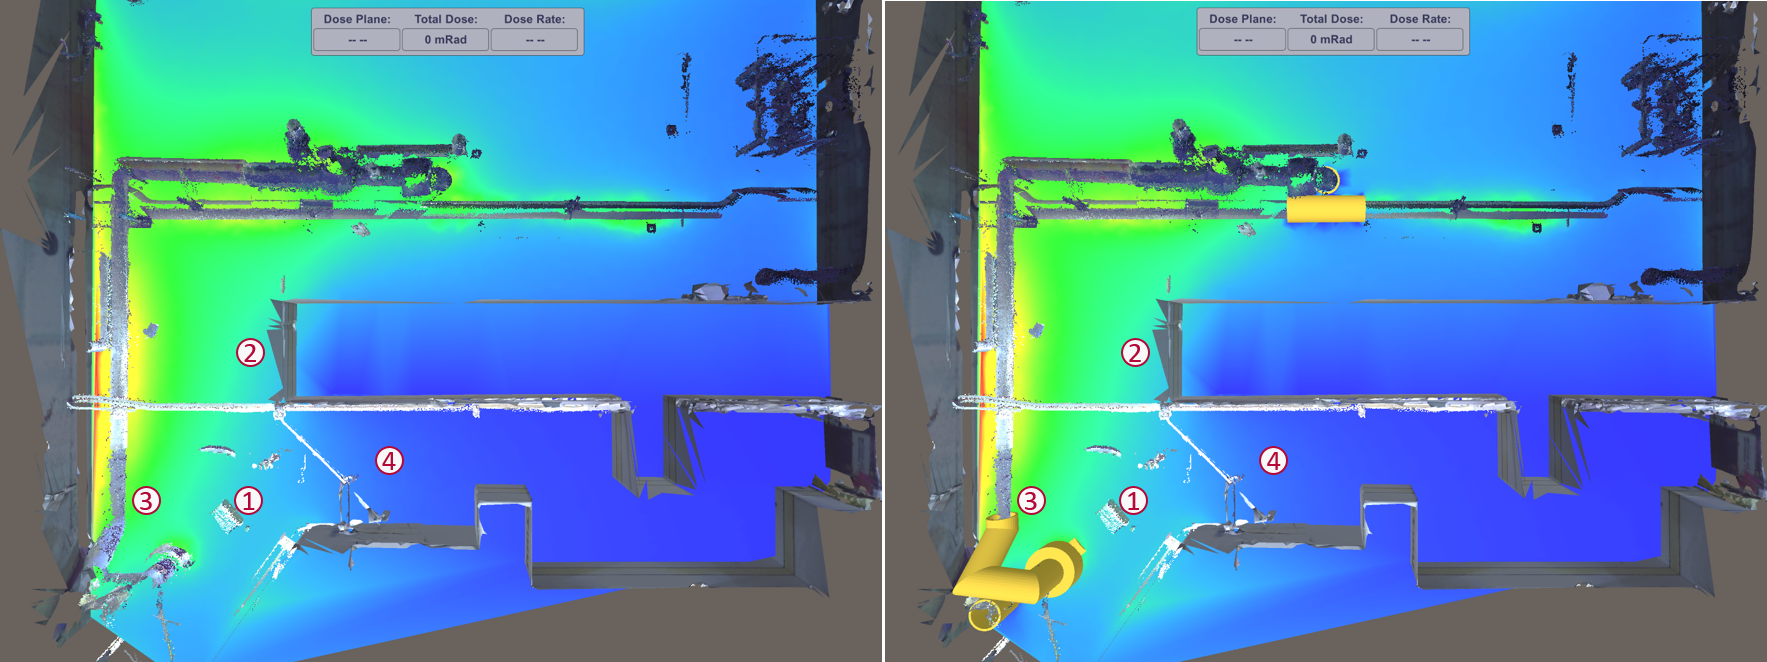
NPO, in conjunction with Transco, performed a RadVision3D scan in the room at four locations. The laser scan 3D point cloud, panoramic camera image, and CZT spectroscopy were combined to create a virtual environment that quantified and located the dose contribution from all sources. Specific locations around the valve were analyzed to determine the impact of various shielding configurations. Several of these configurations were simulated to determine their effectiveness.
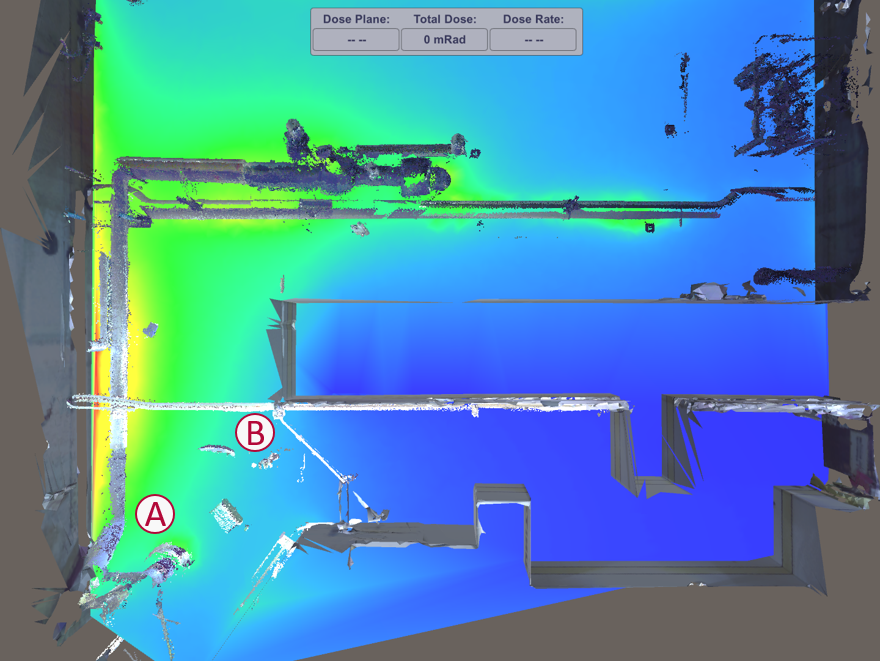
| Survey Location | Survey Data | RadVision3D Data |
| A | 1,300 mRem/hr (13,000 μSv/hr) | 1,304 mRem/hr (13,040 μSv/hr) |
| B | 600 mRem/hr (6,000 μSv/hr) | 635 mRem/hr (6,350 μSv/hr) |
| RadVision3D Data is the average of 5 pick points in the approximate area of the dose survey | ||
| No Shields | Hot Spot Shielding | |||
| mRem/hr (μSv/hr) | mRem/hr (μSv/hr) | Reduction | ||
| Location | 1 | 769 (7,690) | 756 (7,560) | 2% |
| 2 | 918 (9,180) | 901 (9,010) | 2% | |
| 3 | 1283 (12,830) | 1242 (12,420) | 3% | |
| 4 | 290 (2,900) | 286 (2,860) | 1% | |
First, the condition of the room without any shielding was compared to what the dose rates would be like if the hot spots were shielded. This correlated to the shielding plan prior to RadVision3D analysis. Though conventional thinking would point to this being the most effective solution, due to the complex nature and high dose rates in the room, shielding only the hot spots had very little impact on the dose rates.
| Hot Spots | Configuration 1 | |||
| mRem/hr (μSv/hr) | mRem/hr (μSv/hr) | Reduction | ||
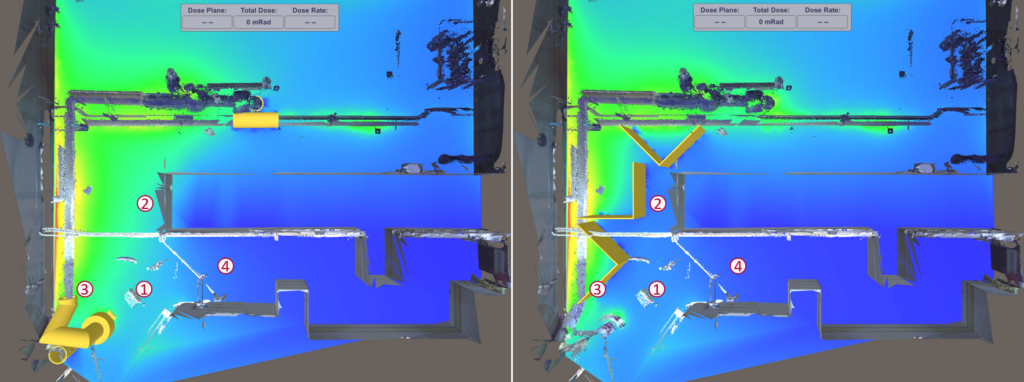
| Location | 1 | 756 (7,560) | 477 (4,770) | 38% |
| 2 | 901 (9,010) | 378 (3,780) | 59% | |
| 3 | 1242 (12,42) | 534 (5,340) | 58% | |
| 4 | 286 (2,860) | 192 (1,920) | 34% | |
With the hot spot shielding determined to be ineffective, different configurations of NPO lead wool blanket racks were tried. Each rack is approximately 3′ (0.91 m) wide and had 1″ (25 mm) lead equivalent shielding.
| Hot Spots | Configuration 2 | |||
| mRem/hr (μSv/hr) | mRem/hr (μSv/hr) | Reduction | ||
| Location | 1 | 756 (7,560) | 362 (3,620) | 53% |
| 2 | 901 (9,010) | 502 (5,020) | 45% | |
| 3 | 1242 (12,420) | 740 (7,400) | 42% | |
| 4 | 286 (2,860) | 155 (1,550) | 47% | |
Without the need to go in the room and validate a shielding configuration by actually installing it, LaSalle was free to see the the dose rates of many different options.
| Hot Spots | Configuration 3 | |||
| mRem/hr (μSv/hr) | mRem/hr (μSv/hr) | Reduction | ||
| Location | 1 | 756 (7,560) | 522 (5,220) | 32% |
| 2 | 901 (9,010) | 531 (5,310) | 42% | |
| 3 | 1242 (12,420) | 740 (7,400) | 42% | |
| 4 | 286 (2,860) | 89 (890) | 69% | |
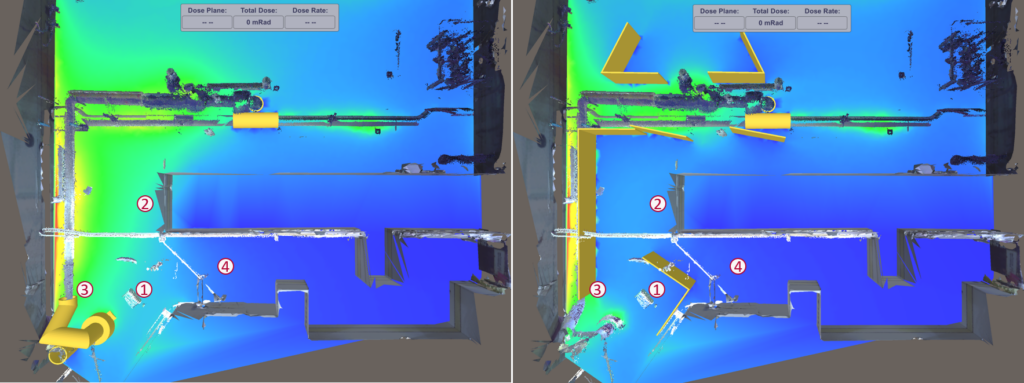
| Hot Spots | Optimized Shielding | |||
| mRem/hr (μSv/hr) | mRem/hr (μSv/hr) | Reduction | ||
| Location | 1 | 756 (7,560) | 422 (4,220) | 45% |
| 2 | 901 (9,010) | 824 (8,240) | 10% | |
| 3 | 1242 (12,420) | 414 (4,140) | 68% | |
| 4 | 286 (2,860) | 169 (1,690) | 42% | |
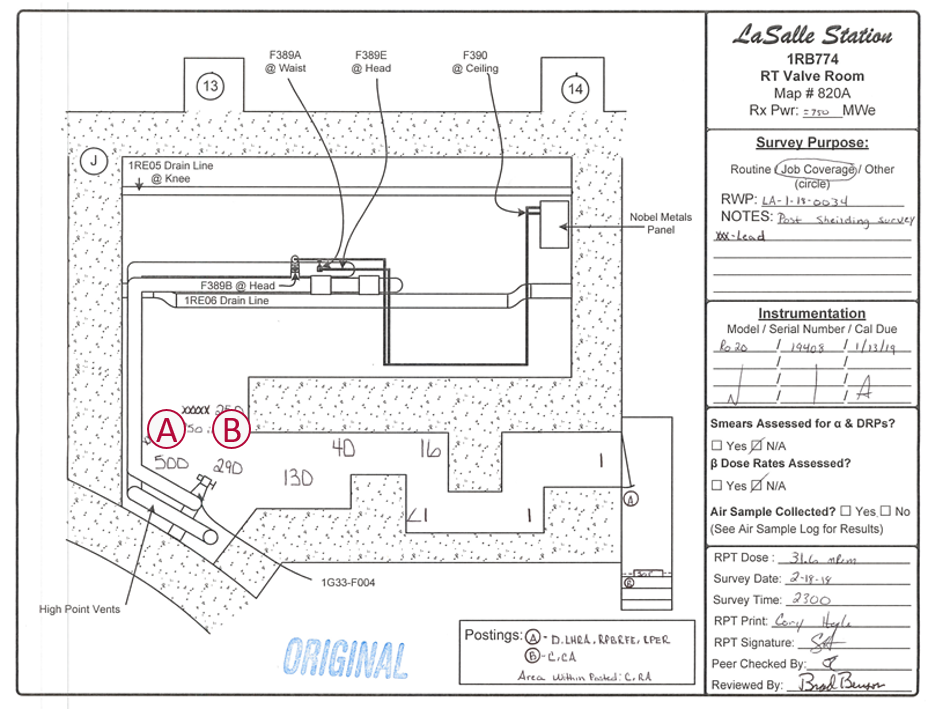
This is the optimal shielding configuration – three lead blanket racks closing off the valve from the rest of the room. The amount of racks are kept to a minimum to cut on installation time and complexity and their specific positioning significantly drops the dose rates in the crucial work areas. Below is the LaSalle post-shielding survey results compared to the RadVision3D predicted results.
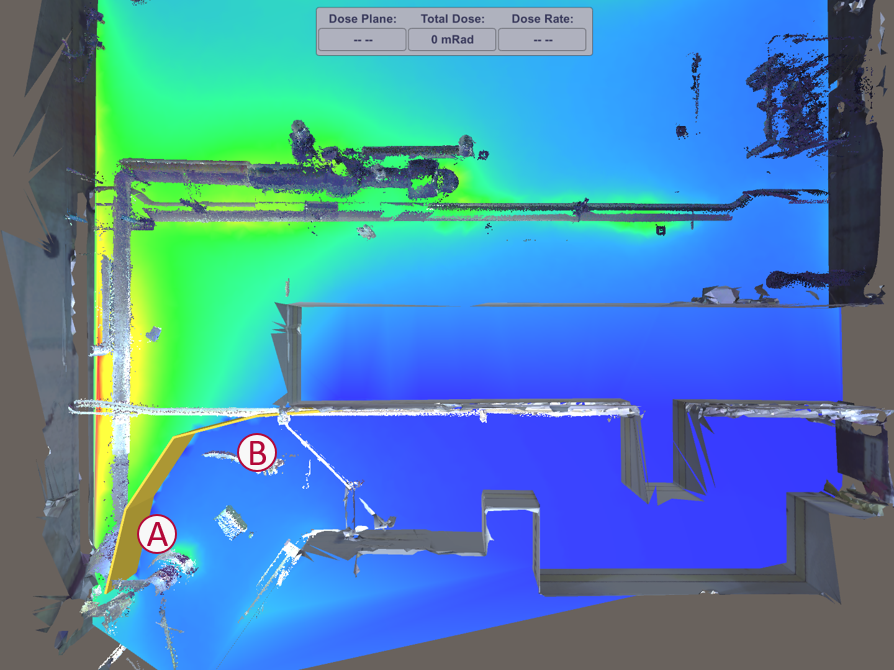
| Survey Location | Survey Data | RadVision3D Data |
| A | 500 mRem/hr (5,000 μSv/hr) | 483 mRem/hr (4,830 μSv/hr) |
| B | 290 mRem/hr (2,900 μSv/hr) | 270 mRem/hr (2,700 μSv/hr) |
| RadVision3D Data is the average of 5 pick points in the approximate area of the dose survey data | ||
The RadVision3D results compare very well with the actual conditions LaSalle experienced. All in all, the scans took 30 mRem (300 μSv/hr), the shielding was installed in 20 minutes and took 163 mRem (1,630 μSv/hr). With the approximate 50% dose reduction overall, LaSalle was able to save 12 Rem (120 mSv) over the course of all work done on this valve.
